A map with 200+ markers across 50 institutions means most people share GPS coordinates. Standard clustering hides them behind bubble counts, a green “10” circle replaces ten individuals. A directory needs every name visible and clickable, but a live map server costs money. The workaround was a static pipeline: R + Leaflet compiles a CSV into a standalone HTML file with zero runtime dependencies.
The previous solution was a Google Maps embed with manually pinned locations. Updating 200+ pins from a spreadsheet is slow and error-prone, and Google Maps API costs scale with loads. The replacement had to accept CSV input, resolve overlapping pins, embed into a WordPress page, and cost zero to run.
R + Leaflet, but no Shiny server: Shiny requires a running server with recurring costs. Instead, the R script runs as a build step: it reads the CSV, resolves coordinate collisions, and emits a single HTML file containing all data and rendering logic. The file is dropped into any WordPress page.
flowchart LR
    A[CSV Data] --> B[R Build Script]
    B --> C[Static HTML File]
    B --> D[Export Module]
    C --> E[WordPress Page]
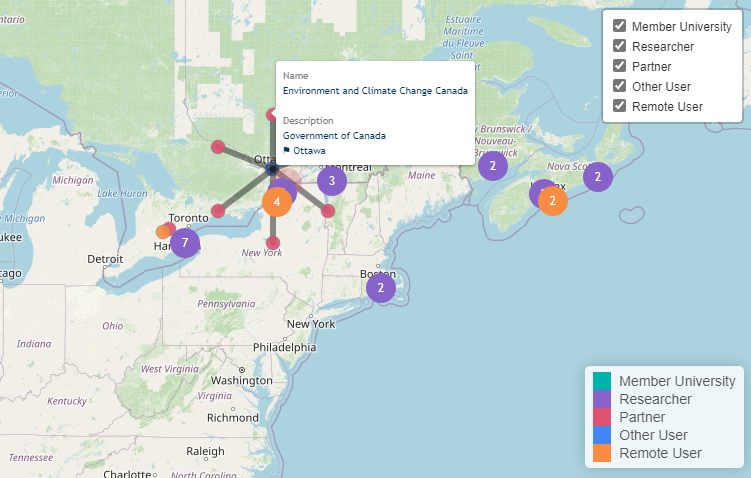
The build script checks for duplicate lat/lng pairs. When markers share a coordinate, it distributes them along a circle around the shared center. The radial offset radius grows with , and markers are placed at evenly spaced angles, each gets a unique position while the circle center preserves the location context. The output is a Leaflet map where every pin is individually clickable.
Where do our researchers come from? Check out our new interactive map! https://t.co/D5glRaTHuI@UVicScience @ubcscience @SFU_Science @ualbertaScience @UofC_Science
— Bamfield MSC (@BamfieldMSC) September 28, 2021
constructed by: @hamzaonde pic.twitter.com/hPc9ChceHD